Posts

Telescope Aperture v/s Visible Astronomy Objects

Image
 Below is the Interesting table to help you identify which Astronomy Objects would be visible using specific aperture of Telescope. Key Points: 1-3 inches : Great for planets, the Moon, and bright stars. Ideal for beginners. 4-6 inches : Start seeing deep-sky objects, including nebulae and galaxies. 8-10 inches : Excellent for detail on planets and deep-sky exploration. 12-16 inches : Advanced deep-sky observation and faint galaxies. 18-20 inches : Professional-level observation, capable of detecting faint cosmic phenomena like gravitational lensing. Credits-Chatgpt Prompt-create a table, which will range all inches of telescope from 1 inch till 20 inches - the table should contain column - telescope inches, astronomy objects visibles

Smart Telescopes - Interesting videos from Youtube.

Image
 This Post contains videos and information about "Smart Telescopes". If you are planning to but "Smart Telescope", then watch the video before buying it! Some of the Smart Telescopes Seestar S50 Seestar S30 DWARF 3 To know more about the above kindly visit below Youtube channels links. https://www.youtube.com/@AstroForumSpace DWARF 3 VS Seestar S50 Smart Telescope Review + Tutorial https://www.youtube.com/@the_space_koala SeeStar S30 Tried & Tested - Does The Smallest Telescope Ever Measure Up to The S50? Credits- https://www.youtube.com/@AstroForumSpace https://www.youtube.com/@the_space_koala

Spica star - Single Source Search - ARI's Gaia Services

Image
 example of Single Source Search - using ARI's Gaia Services For demonstration we will use Star - Spica  ( in Virgo Constellation). This star is also called as "Alpha Vir". Open the website - https://gaia.ari.uni-heidelberg.de/singlesource.html In the search box  Object name type  "Alpha Vir" and press enter button Below are the results(Image, Table information, Wavelength v/s Flux graph) 1)Image- Used Layer icon to select different type and style of images. In this case default image is "DSS colored" Base image layer and "Native" is Color map. Use these two features Base image layer & Color map to select different images(by different cameras and color filters) 2)Table- Provides various astronomical information such as location, motion, magnitude and more.Below is partial view of table 3)Wavelength v/s Flux graph One can use this information to understand object in details, knows its features and use it in there astronomy projects/acti...

Python code to fetch Eta Carinae nebula FITS image and Display

Image
In Astronomy, there will be needs to extract Images from FITS format file for further analysis or research, Below is the Two steps code for "getting image link" and "fetching & displaying image from the link"  The code uses python libraries such as PYVO,  Astropy, Matplotlib STEP 1-excute below code to get url of the astronomical object import pyvo as vo from astropy.coordinates import SkyCoord from astropy.units import Quantity pos = SkyCoord.from_name('Eta Carina') #Eta Carina Nebula size = Quantity(0.5, unit="deg") sia_service = vo.dal.SIAService("http://dc.zah.uni-heidelberg.de/hppunion/q/im/siap.xml") sia_results = sia_service.search(pos=pos, size=size) sia_results  -------------- its will list all FITS format image from online repository------------ <Table length=8> accref ... ...

what is Astronomical Data Query Language (ADQL)?

  What is Astronomical Data Query Language (ADQL)? Astronomical Data Query Language (ADQL) is a specialized query language used by astronomers to retrieve data from large astronomical databases . It is similar to SQL (Structured Query Language) but designed specifically for querying catalogs of stars, galaxies, and other celestial objects.  ADQL allows users to perform complex searches, such as filtering objects by position, brightness, or velocity , across vast datasets.  It is widely used in Virtual Observatory (VO) services , making it easier for researchers to access and analyze astronomical data.  With ADQL, astronomers can extract precise information to support their research.

Python code to fetch RA-DEC of NGC 1952 (Crab Nebula)

 Below is simple python code to fetch RA-DEC of Card Nebula ( NGC 1952) using Astropy library /*****/ from astropy.coordinates import SkyCoord from astropy.units import Quantity pos = SkyCoord.from_name('NGC 1952') print(pos) /******/ output- <SkyCoord (ICRS): (ra, dec) in deg (83.633212, 22.01446)>

Python Code to Plot position of planets on RA-DEC Grid

Image
 Below is Python  Output & Code to "Plot position of planets on RA-DEC Grid". Change the Setting parameters - Longitude, Latitude and Time. The comments "#" gives short description of the code. You may need to install the required libraries. *************************************************************************** from astropy.coordinates import EarthLocation, AltAz, get_sun, get_moon, solar_system_ephemeris, get_body from astropy.time import Time import astropy.units as u import matplotlib.pyplot as plt def plot_planet_positions(date_time, latitude, longitude):     # Define observer's location     observer_location = EarthLocation(lat=latitude*u.deg, lon=longitude*u.deg, height=0*u.m)          # Define the time of observation     observing_time = Time(date_time)          # List of planets     planets = ['mercury', 'venus', 'earth', 'mars', 'jupiter', 'saturn', 'uranus', 'neptu...

Algol - Show Future Eclipse Dates using Python

  Python Code Algol , is also called as Demon Star. It is a bright triple star system in the constellation Perseus. It is one of the first known eclipsing binaries, where the primary star is regularly dimmed by its companion passing in front of it. Algol's periodic dimming has made it a subject of fascination and study since ancient times. Below is snippet of python code to show next eclipse 5 dates. *************************************************** import ephem # Define Algol algol = ephem.star('Algol') # Set observer location (e.g., New York) observer = ephem.Observer() observer.lat = '40.7128'  # Latitude of New York observer.lon = '-74.0060'  # Longitude of New York observer.elevation = 10  # Elevation of New York (in meters) # Set the current date and time observer.date = ephem.now() # Predict the next 5 eclipse events. You can change the parameter in range(N) function for i in range(5):     next_eclipse = observer.next_setting(algol)     ...

Create Basic Astronomy Simulation - Halley's Comet

Image
 Kids Activity - Create Halley's Comet stimulation using Chat GPT It is easy to create basic simulation using Chat GPT by giving  prompt .Below is example of sample prompt "create java script code to create Halley's comet such that it is orbiting Sun. Also show distance in number" User can create more creative prompt Below is JavaScript code which created above graphical simulation (just copy past in note pad and save file as html and then open in browser) <!DOCTYPE html> <html lang="en"> <head>   <meta charset="UTF-8">   <meta name="viewport" content="width=device-width, initial-scale=1.0">   <style>     canvas {       border: 1px solid #000;       display: block;       margin: 20px auto;     }   </style>   <title>Comet Animation</title> </head> <body>   <canvas id="solarSystemCanvas" width="800" height="800">...

Astronomy Python - Crab Nebula - Combine RGB channel images into One Image

Image
 In Astronomy, Image taken by cameras would be based on specific filters(channels)-Red, Green, Blue. Below are the the images taken across 3 channels. Red(Left), Green(Centre), Blue(Right) Original image credit(single image which is not shown here)- Credits: NASA, ESA, J. Hester and A. Loll (Arizona State University) Below is result after combining above 3 channel images Below is the python code used. Original Carb Nebula image is spitted    into 3 channels(as shown 3 gray images above) *************************************************** from PIL import Image # Open the red, green, and blue channel images red_channel = Image.open('E:\\astronomy_related\\rbg_one\\red.png') green_channel=Image.open('E:\\astronomy_related\\rbg_one\\green.png') blue_channel =Image.open('E:\\astronomy_related\\rbg_one\\blue.png') # Create a new RGB image result = Image.merge("RGB", (red_channel, green_channel, blue_channel)) # Save the result image result.save('E:\\astr...

Astronomy Python - Hubble Ultra Deep Field - Invert Colors

Image
 In Astronomy, while studying Deep Field images, it would be necessary to invert the color of the image, to find out the object with a lesser magnitude. Deep Field images contains 10,000 of galaxies or stars with varying magnitudes. Below is the original image(left) and color inverted image(right). Image credit-NASA, ESA, and S. Beckwith (STScI) and the HUDF Team Below is the short  python code used. ********************************************************************** import cv2 image = cv2.imread("E:\\astronomy_related\\invert_image_colors\\HUD.jpg", 0) inverted_image = cv2.bitwise_not(image) cv2.imwrite("E:\\astronomy_related\\invert_image_colors\\HUD_inverted.jpg", inverted_image ) ********************************************************************** Credits- Image Credit- NASA, ESA, and S. Beckwith (STScI) and the HUDF Team https://esahubble.org/images/heic0406a/ code credit- https://www.delftstack.com/howto/python/opencv-invert-image/

Astronomy Python - Jupiter Planet - Cropping Red Gaint Spot

Image
 In Astronomy, there will be often need to crop(cut) certain part of image.  By using cropping technique, it becomes easy to highlight import part of the image, as shown in the below example,  Red Giant Spot is cropped and then shown in another window (top right). Image credit -Nasa Jupiter Below is the python code used. When code is executed original image appears and then selected the part of the image which you want to cut. ****************************************************************** import cv2 import numpy as np    # Read image image = cv2.imread("E:\\astronomy_related\\image_crop\\jupiter.jpg")    # Select ROI r = cv2.selectROI("select the area", image)    # Crop image cropped_image = image[int(r[1]):int(r[1]+r[3]),                        int(r[0]):int(r[0]+r[2])]    # Display cropped image cv2.imshow("Cropped image", cropped_image) cv2.waitKey(0) *********...

Astronomy Python - Webb's First Deep Field - Putting Grid Lines

Image
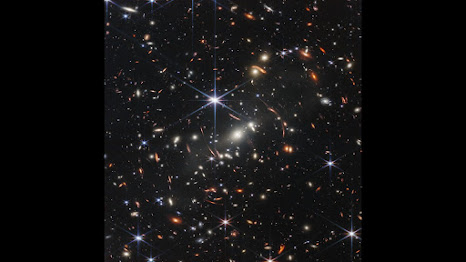
 In Astronomy, putting a grid line (with number blocks) on Image (planets, star field etc.) will simplify the image understanding process.  Each block could be treated as smaller part of the big image and block number could be used as reference number to locate an object. In the below example, a grid with number block(green in color) is applied to  Webb's First Deep Field image. Image Credits: NASA, ESA, CSA, STScI(without gird) Below is the python code used. ********************************************************************** import matplotlib.pyplot as plt import matplotlib.ticker as plticker try:     from PIL import Image except ImportError:     import Image # Open image file image = Image.open('E:\\astronomy_related\\xy_grid\\webb_first_deep_field_n.png') # Set up figure gridLineWidth=100 fig=plt.figure(figsize=(float(image.size[0])/gridLineWidth, float(image.size[1])/gridLineWidth), dpi=gridLineWidth) axes=fig.add_subplot(111) # Remove whitespac...

Astronomy Python - Webb's First Deep Field - Marking the Edges of the Galaxies

Image
  In Astronomy, the image taken by telescopes of deep space field, galaxies, planets may appear to be complex - it may be difficult to find boundaries of objects when objects are too near. Or  simply one would like to know the shape of the object. Edge detection technique is used in image processing for finding the boundaries of objects within the image. Edge detection would be very useful while analyzing such difficult images. Below is the sample image taken by James Webb telescope. Image Credits: NASA, ESA, CSA, STScI Below is grey image(left) and edge detection image(right) An edge detection operato r used in the above example is called as Canny edge detector Below is the python code used. ********************************************************************** import cv2 import numpy as np import matplotlib.pyplot as plt # read the image image = cv2.imread("E:\\astronomy_related\\edge_detection\\webb_first_deep_field.jpeg") # convert it to grayscale gray...

Astronomy Python - Mars Planet Surface - Creating Sharpen Image from Blur Image

Image
   In Astronomy, sometimes the images send by satellite/telescope could be Blur and one would be interested to make the image Sharpe. The Kernel (it is matrix representation) is to process the image -from Blur image to Sharpe Image. Convolution Matrix, Mask, Matrix/Array are the other names given to the Kernel.                           Below is the example of Mars Surface Blur Image Image Credit: NASA/JPL-Caltech Below is the processed image which has now become  Sharpe Image   Please  open both images to see the effect.7 Below is the python code used. ****************************************************************** # load the required packages import cv2 import numpy as np # load the image into system memory image = cv2.imread('E:\\astronomy_related\\blurr_to_clear_image\\marssurface_blurr.jpg', flags=cv2.IMREAD_COLOR) # display the blurr image to the screen cv2.imshow('Mars Surface blurr...

Astronomy Python - Creating Histogram of the Asteroid

Image
 Histogram of Image help us to understand distribution of color values in the image. In the below images, left image is of asteroid Bennu and right image is of Histogram. Below is the Python code used to create Histogram. **************************************************************************** from PIL import Image import numpy as np import matplotlib.pyplot as plt # Open the image file img = Image.open("E:\\astronomy_related\\image_to_histogram\\asteroid_bennu.jpg") # Convert the image to grayscale img = img.convert("L") # Convert the image data to a numpy array data = np.array(img) # Plot the histogram plt.hist(data.ravel(), bins=256, range=(0, 256), fc='k', ec='k') plt.show() ***************************************************************************** Credits and Information- Code Credit-(Some modification is done in original code as per the need) https://chat.openai.com Image Cedit and Information https://www.nasa.gov/image-feature/osiris-re...

Astronomy Python - Coloring Grey Image using False Color

Image
 In Astronomy, the images send by satellite/telescope are often "Grey Color(scale) images". False coloring Technique is used to highlight the features in the grey colored images. Below is the example of Mars Surface & Rover in grey Colored(left image) and False colored(right image) Image Credit: NASA/JPL-Caltech Below is the python code used. Instead of using RBG(Reb, Blue and Green), Orange ,Blue & Black colors are used. ****************************************************************** from PIL import Image # Open the image img = Image.open("E:\\astronomy_related\\falseimage_color\\mars_surface_rover.jpg") # Convert the image to a 3-channel RGB image rgb_img = img.convert("RGB") # Get the pixel data as a 2D array pixels = rgb_img.load() # Loop through each pixel and change its color based on its intensity for i in range(img.width):     for j in range(img.height):         r, g, b = pixels[i, j]              ...

Astronomy Python - Chatgpt based- Stich Images Horizontally

Image
 Often  there will be need to put images one beside another for analyzing .  For example we have 3 images (shown below)and we want to align it in one single image one beside another. Below is the python script,   Special Thanks and all credit goes to "Chatgpt", who has generated the code, which will align the images one beside another. Below is the output. Individual Images are taken from below website https://asd.gsfc.nasa.gov/archive/mwmw/mmw_sci.html Python code below ******************************************************************* from PIL import Image # Open the images image1 = Image.open("E:\\astronomy_related\\imageoverlay\\image1.jpg") image2 = Image.open("E:\\astronomy_related\\imageoverlay\\image2.jpg") image3 = Image.open("E:\\astronomy_related\\imageoverlay\\image3.jpg") # Create a list of images images = [image1, image2, image3] # Determine the width and height of the final image widths, heights = zip(*(i.size for i in images)) to...